The pipeline editor
The pipeline editor is where you build a pipeline by placing steps on a canvas, connecting them, adjusting their settings and watching runs live.
Create or open a pipeline
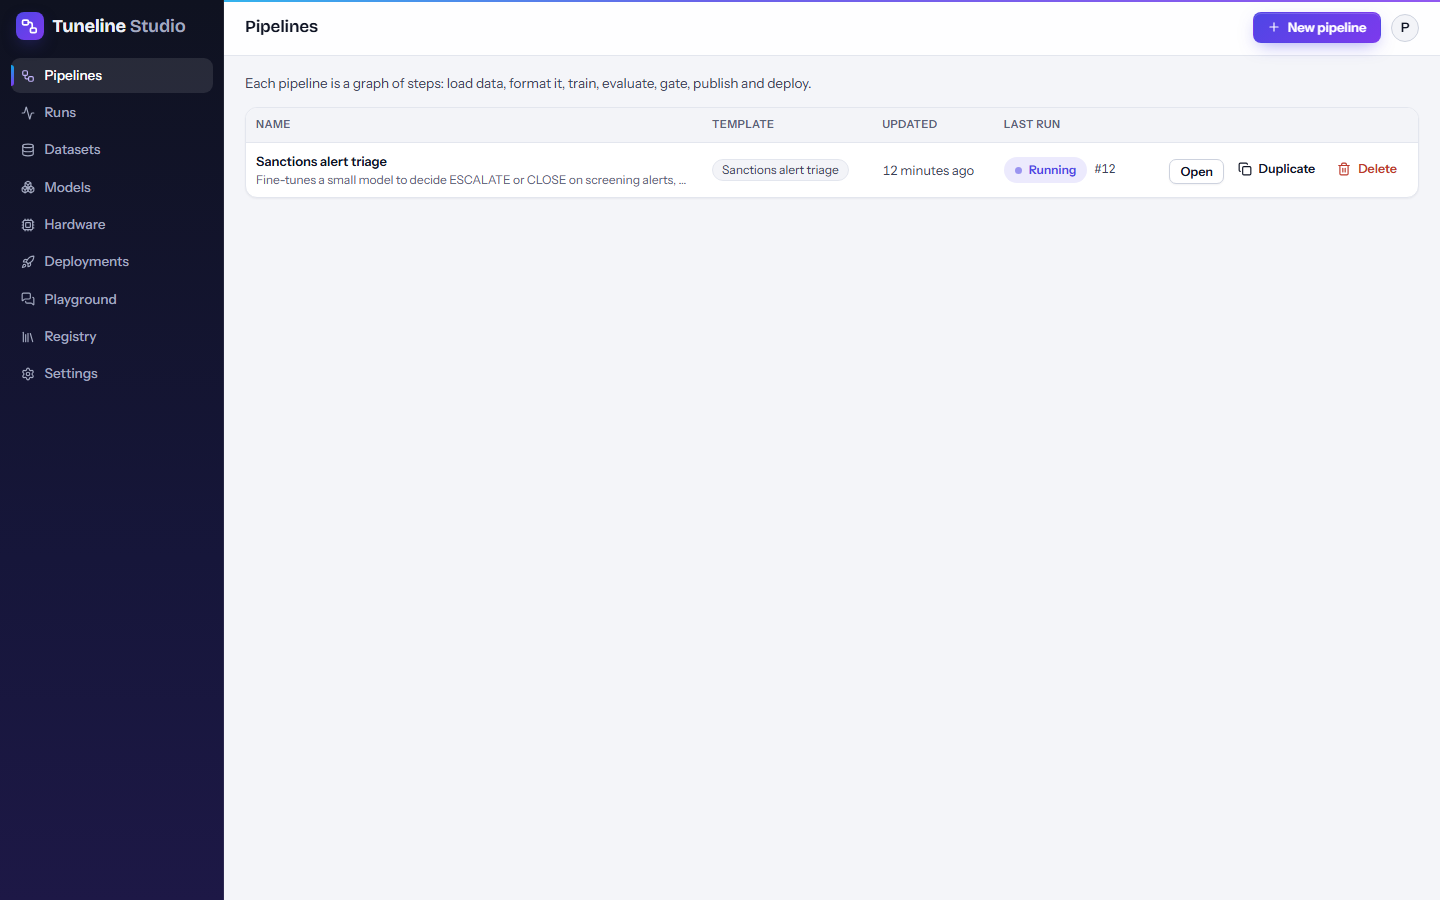
The Pipelines page lists your pipelines with their template, when they were last updated and the status of their last run. Each row has Duplicate and Delete actions. Deleting a pipeline keeps its runs; they stay listed under Runs.
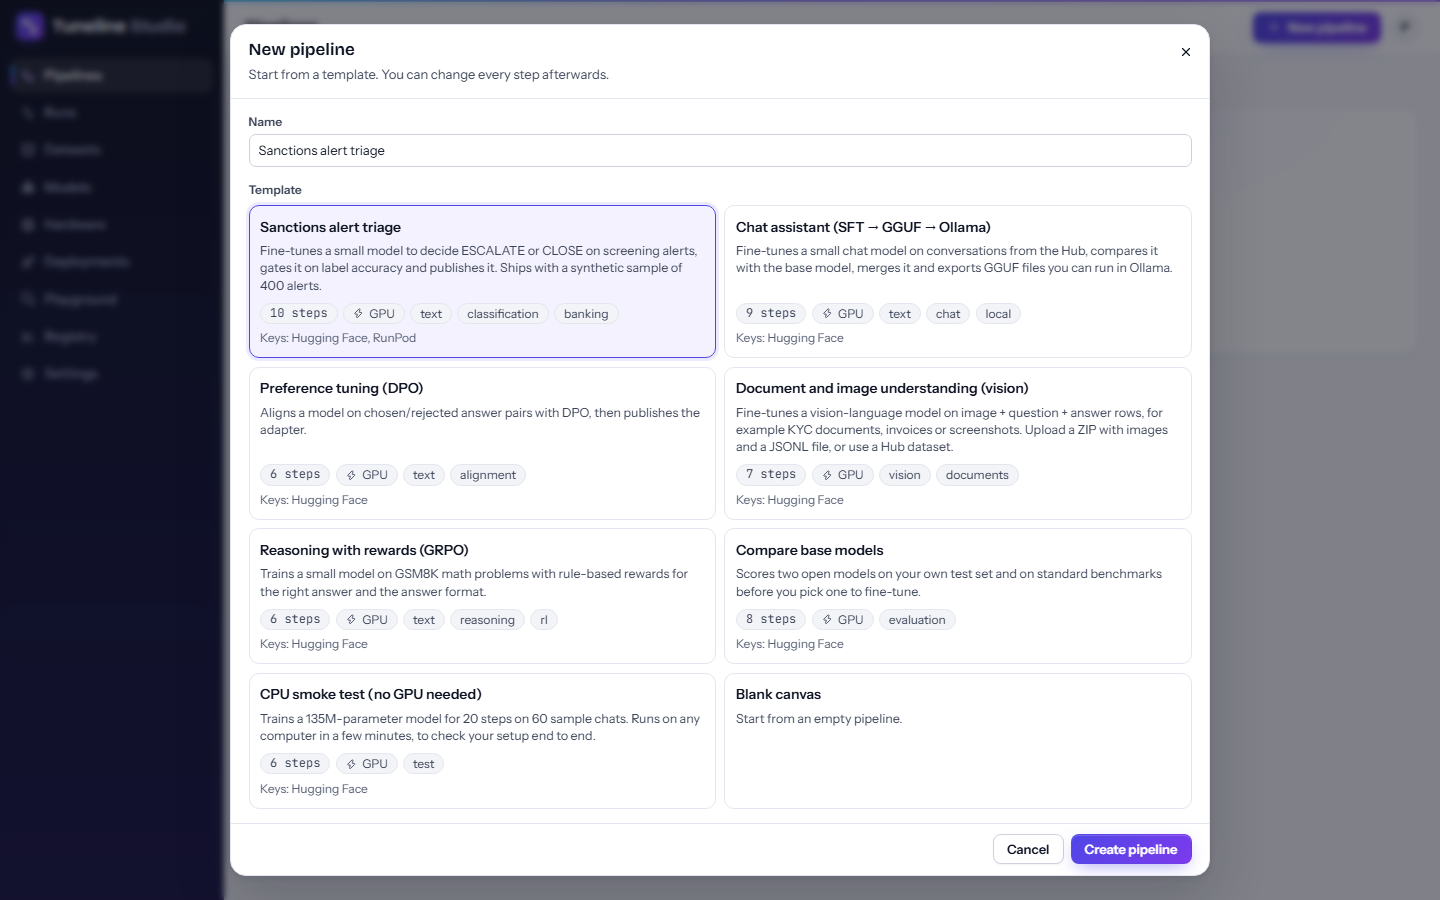
To create one:
- Click New pipeline.
- Enter a Name.
- Pick a Template. Each card shows how many steps it has, whether it needs a GPU or runs on CPU only, and which keys it uses. Blank canvas starts empty.
- Click Create pipeline. The editor opens.
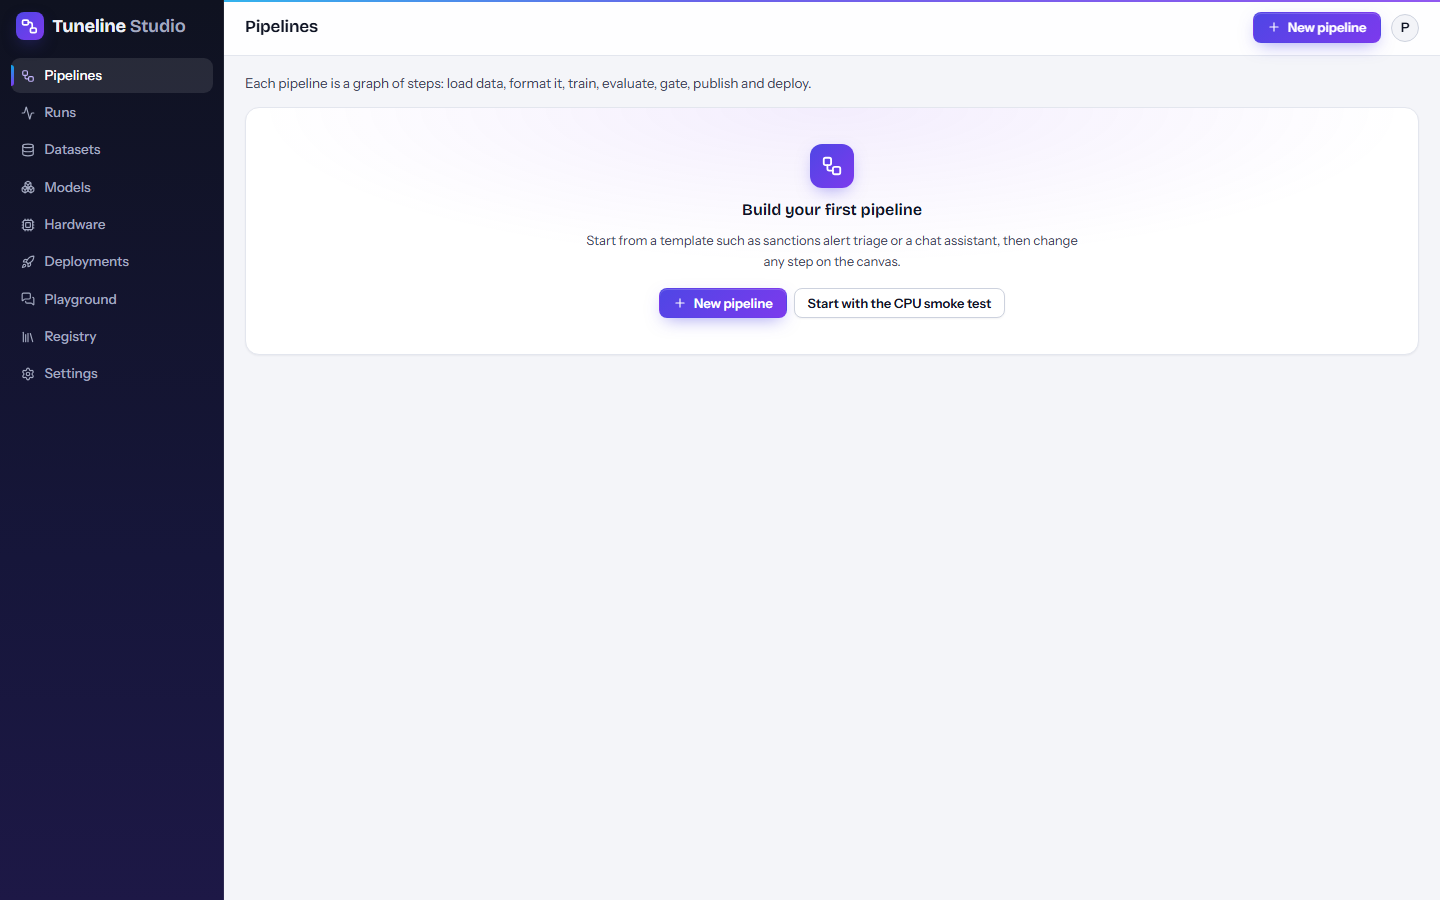
The first time you sign in, the Pipelines page is empty and shows a short checklist: add a Hugging Face token, pick a place to run, and try the CPU smoke test template.
The editor layout
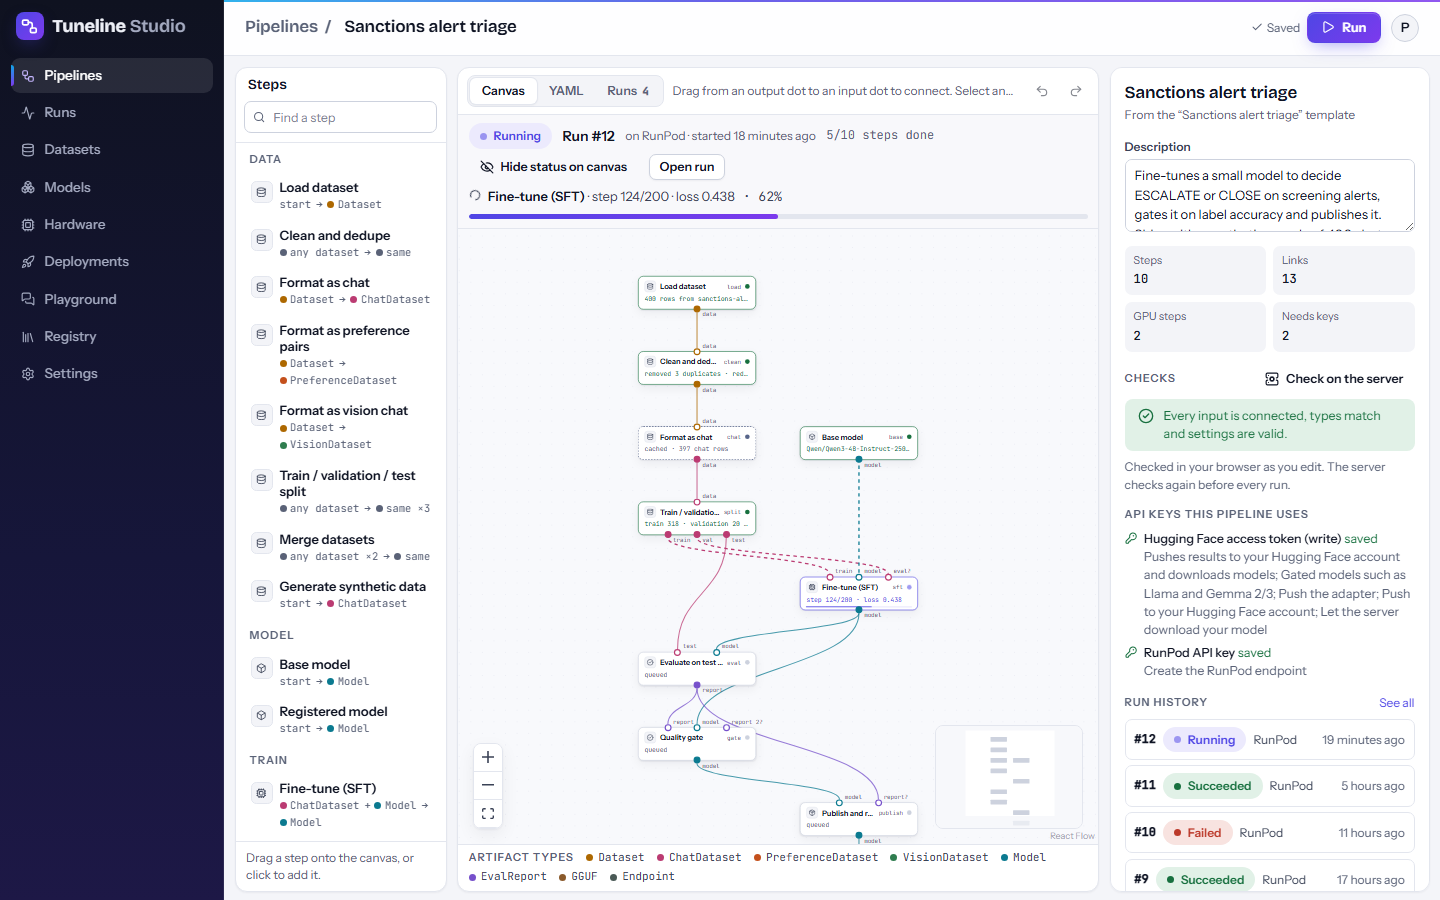
The editor has three columns:
| Area | What it does |
|---|---|
| Steps palette (left) | Every step you can add, grouped by category. |
| Canvas (centre) | The graph. Tabs above it switch between Canvas, YAML and Runs. |
| Inspector (right) | Settings of the selected step, or a summary of the whole pipeline when nothing is selected. |
The pipeline name at the top of the page is editable: click it and type. The Run button in the top bar opens the Run dialog.
Add steps from the palette
The palette lists steps under Data, Model, Train, Evaluate, Export and Deploy. Under each step's name you see what it takes and what it gives, for example Dataset → ChatDataset or start → Model (a step that starts a branch). The coloured dots match the artifact type colours.
- Search: type in Find a step to filter by name or description.
- Drag a step onto the canvas to place it where you drop it.
- Click a step to add it near the centre of the canvas.
A new step arrives selected, so its settings open straight away in the inspector. A message reminds you to connect its inputs.
Tip
On an empty canvas, start with Load dataset and Base model. Every training pipeline needs both.
Connect steps
Inputs are the dots along the top of a step; outputs are the dots along the bottom. Each dot is coloured by its artifact type and labelled with its port name (for example train, model, eval?; a ? means the input is optional).
To connect two steps, drag from an output dot to an input dot. The link takes the colour of the artifact it carries.
The editor checks every link as you make it:
- Types must match. If they don't, the link is refused and a message explains which type the input expects and what the output gives. When a converter step exists, the message suggests it, for example: Fine-tune (SFT) expects ChatDataset on “train”, but Load dataset gives Dataset. Put a 'Format as chat' node between them. Other suggestions include Format as preference pairs, Format as vision chat, Export GGUF, Deploy endpoint, Ollama package and Endpoint smoke test.
- One link per input. Dropping a new link on an input that is already connected replaces the old link.
- No loops. A link that would make the pipeline flow back on itself is refused.
- An output can feed as many inputs as you like.
Links into a step that has a type problem are drawn as red dashed lines until you fix it.
Select, delete and undo
- Click a step or a link to select it. To select several, hold Shift and drag a box around them, or Ctrl-click each one (Cmd-click on macOS).
- Press Delete (or Backspace) to remove the selection. Deleting a step also removes its links.
- Press Esc to clear the selection.
When something is selected, a bar appears under the canvas:
| Selection | Bar shows |
|---|---|
| One step | Its name, Edit settings (jumps to the inspector) and Delete node |
| One link | source.port → target.port and Remove link |
| Several items | How many steps and links are selected, and Delete selection |
Undo and redo buttons sit at the right of the tab bar. The keyboard shortcuts are Ctrl+Z for undo and Ctrl+Shift+Z (or Ctrl+Y) for redo; on macOS use Cmd. The editor keeps the last 50 changes.
Move around the canvas
- Zoom with the mouse wheel or the + and − buttons in the bottom-left corner; the third button fits the whole pipeline in view.
- Pan by dragging an empty part of the canvas.
- The mini map in the bottom-right corner shows the whole graph; drag or scroll on it to move. Steps with problems show in red there.
- Steps snap to a grid when you move them, so pipelines stay tidy.
Under the canvas, the Artifact types legend shows the colour of each type. Hover a type for its description.
The inspector: edit a step
Select a single step to open its settings in the inspector.
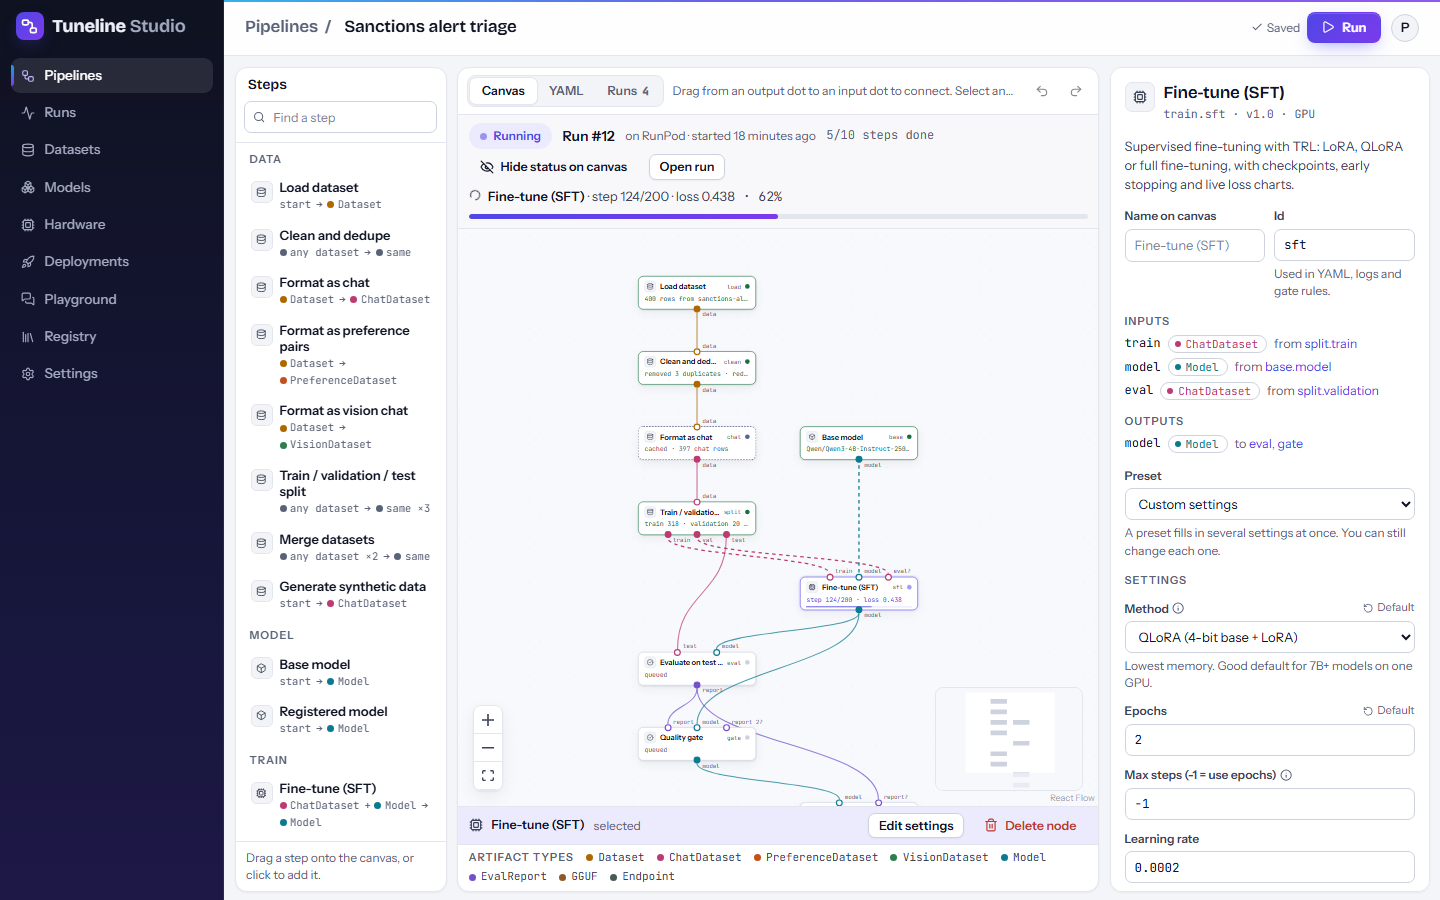
From top to bottom, the inspector shows:
- Title and type line: the step's name, its type and version, and where it runs (GPU, CPU or network only). Steps that are never cached say "always runs".
- Description of what the step does, and any problems with it (for example an input that isn't connected).
- Name on canvas: a display name for this step. Leave it empty to use the default name.
- Id: the step's identifier, used in YAML, logs and gate rules. It must start with a lowercase letter and use only
a-z,0-9or_(40 characters at most). Press Enter or click away to apply; links follow the new id. Press Esc to undo your typing. - Inputs: each input with its type and the step it comes from (
from split.train), or "not connected". Click a source to jump to that step. - Outputs: each output with its type and the steps it feeds (
to eval, gate), or "not used yet". - Preset (only on steps that have presets, such as Fine-tune (SFT) with QLoRA quick, LoRA quality, Full fine-tune (small models) and CPU smoke test): a preset fills in several settings at once. You can still change each one afterwards; the list then shows Custom settings.
- Settings: the form for this step (see below).
- API keys: the keys this step needs with its current settings, whether each is saved, and a link to add it in Settings.
- Delete node.
Settings
The most important settings appear first, under the step's basics. Others are grouped in collapsible sections such as LoRA adapter, Batch and memory, Optimizer, Evaluation and checkpoints, Speed-ups, Hugging Face Hub and Advanced. A section with an invalid value opens itself and says "needs attention".
- Defaults: every setting starts with a default. When you change one, a Default link appears next to its label; click it to go back to the default value.
- Help: the (i) icon next to a label explains the setting. For choice lists, the selected option's explanation appears under the field.
- Required settings are marked with a red asterisk.
- Show-if fields: some settings only appear when they apply. For example, the LoRA rank appears only when Method is QLoRA or LoRA, and the Hugging Face repository name only when Push to Hugging Face is on. On Load dataset, the fields change with Source.
- Numbers show their allowed range as a placeholder; a value outside it is flagged under the field and in Checks.
Some settings have special pickers:
| Setting kind | How you fill it |
|---|---|
| Model (for example Base model → Model) | Type any Hugging Face repository id, or click Browse to open Pick a model: the Catalog tab lists the curated models, Search the Hub searches Hugging Face. |
| Dataset (on Load dataset with Uploaded file) | Pick one of your dataset versions: each entry shows the name, version, file and row count. Upload a dataset / Manage datasets opens the Datasets page. |
| Golden set | Pick one of your golden sets, or follow the link to create one in the Playground. |
| Model version (on Registered model) | Pick a version from your registry. |
| Rules (on Quality gate) | A text box with one rule per line, such as label_accuracy >= 0.9. Buttons under the box add a rule for each metric the connected reports produce. Lines that can't be read are flagged as you type. See Evaluation and quality gates. |
The pipeline summary: nothing selected
Click an empty part of the canvas (or press Esc) and the right panel shows the pipeline as a whole:
- Name, template and Description. The description is saved with the pipeline.
- Counts: Steps, Links, GPU steps (steps that need a GPU, or "none") and Needs keys (how many API keys the pipeline uses).
- Checks: problems to fix before running, and warnings that don't block a run (for example a step whose output isn't used). Click a problem to jump to the step. When everything is fine it says Every input is connected, types match and settings are valid. These checks run in your browser as you edit; Check on the server runs the same checks on the server, and the server checks again before every run anyway.
- API keys this pipeline uses: each key with the reasons it is needed and whether it is saved. Missing keys link to Settings → API keys ("not saved: add it", or "optional: add it" for keys that are only nice to have).
- Run history: the last five runs of this pipeline with their number, status, target and time. See all opens the Runs tab.
Canvas, YAML and Runs tabs
- Canvas is the visual editor described on this page.
- YAML shows the same pipeline as text. You can copy it, download it, edit it and click Apply YAML to replace the canvas. The format is described in Pipeline YAML.
- Runs lists every run of this pipeline. Click one to open its run page.
Autosave
There is no Save button. The editor saves about one second after your last change, and the top bar shows where it stands:
| Indicator | Meaning |
|---|---|
| Saved | Everything is stored. |
| Unsaved changes | A save is about to happen. |
| Saving… | The save is in progress. |
| Couldn't save with Retry | The save failed (for example, you went offline). Hover for the reason, then click Retry. |
Starting a run always saves first, so a run never misses your latest edit.
Watch a run on the canvas
While a run of this pipeline is queued or running, the editor shows it live. You can keep editing; the run uses the copy of the pipeline it started with.
The live run banner
A banner above the canvas shows:
- the run's status and Run #N;
- where it runs, for example "on RunPod" or "on your computer “office-4090”";
- when it started, and how many steps are done, for example 5/10 steps done;
- the step that is working now, with its message and percentage, for example Fine-tune (SFT) · step 124/200 · loss 0.438 · 62%;
- a progress bar for the whole run.
Before the job is up, the banner says what it is waiting for: Starting on RunPod… The first steps appear here as soon as the job is up, or for your own computer, Waiting for your computer “name” to pick it up (within 30 seconds)…. If that computer isn't connected, the banner says so and links to Settings → Your computers.
The banner has two buttons:
- Hide status on canvas / Show status on canvas: turns the status colours on the steps off or on, so you can see validation hints while you edit.
- Open run: opens the run page with logs, metrics, evaluation and artifacts.
When the run ends, the banner stays with the result (Finished in … on RunPod, or the step that failed and its error). Close it with the X button.
Steps on the canvas
With status shown on the canvas, each step takes the colour of its status (see step statuses) and its second line shows the step's latest message instead of its settings summary, for example cached · 397 chat rows or step 124/200 · loss 0.438. A running step shows a progress bar along its bottom edge, and the links flowing into it are animated.