Your first pipeline in 10 minutes
In this tutorial you create the CPU smoke test (no GPU needed) pipeline from a template, run it on your own computer or in a notebook, watch it live and read its results.
The smoke test fine-tunes a tiny 135-million-parameter model for 20 steps on 60 sample chats, then scores it against the untrained base model. The result isn't a useful model; the point is to check the whole path from start to finish (job start, live logs and metrics, step statuses and the evaluation report) in a few minutes, for free.
Before you start
You need:
- A Tuneline account. See Install.
- Somewhere to run the pipeline, either of:
- My computer: a computer you connected in Settings → Your computers (how). Any computer works; no GPU is needed.
- Notebook: a Google account for Google Colab, or any Jupyter server. Nothing to set up in advance.
You don't need any API keys for this template, and it doesn't publish a model anywhere.
Note
The template card lists "Keys: Hugging Face" because Tuneline uses a Hugging Face token whenever you have saved
one (for example to cache intermediate results in a private tuneline-cache dataset in your account). For the
smoke test the token is optional.
1. Create the pipeline
- Open Pipelines in the left sidebar and select New pipeline. (On an empty Pipelines page you can also select Start with the CPU smoke test, which does steps 2 to 4 for you.)
- Under Template, choose CPU smoke test (no GPU needed).
- Keep the suggested name, or type your own in Name.
- Select Create pipeline.
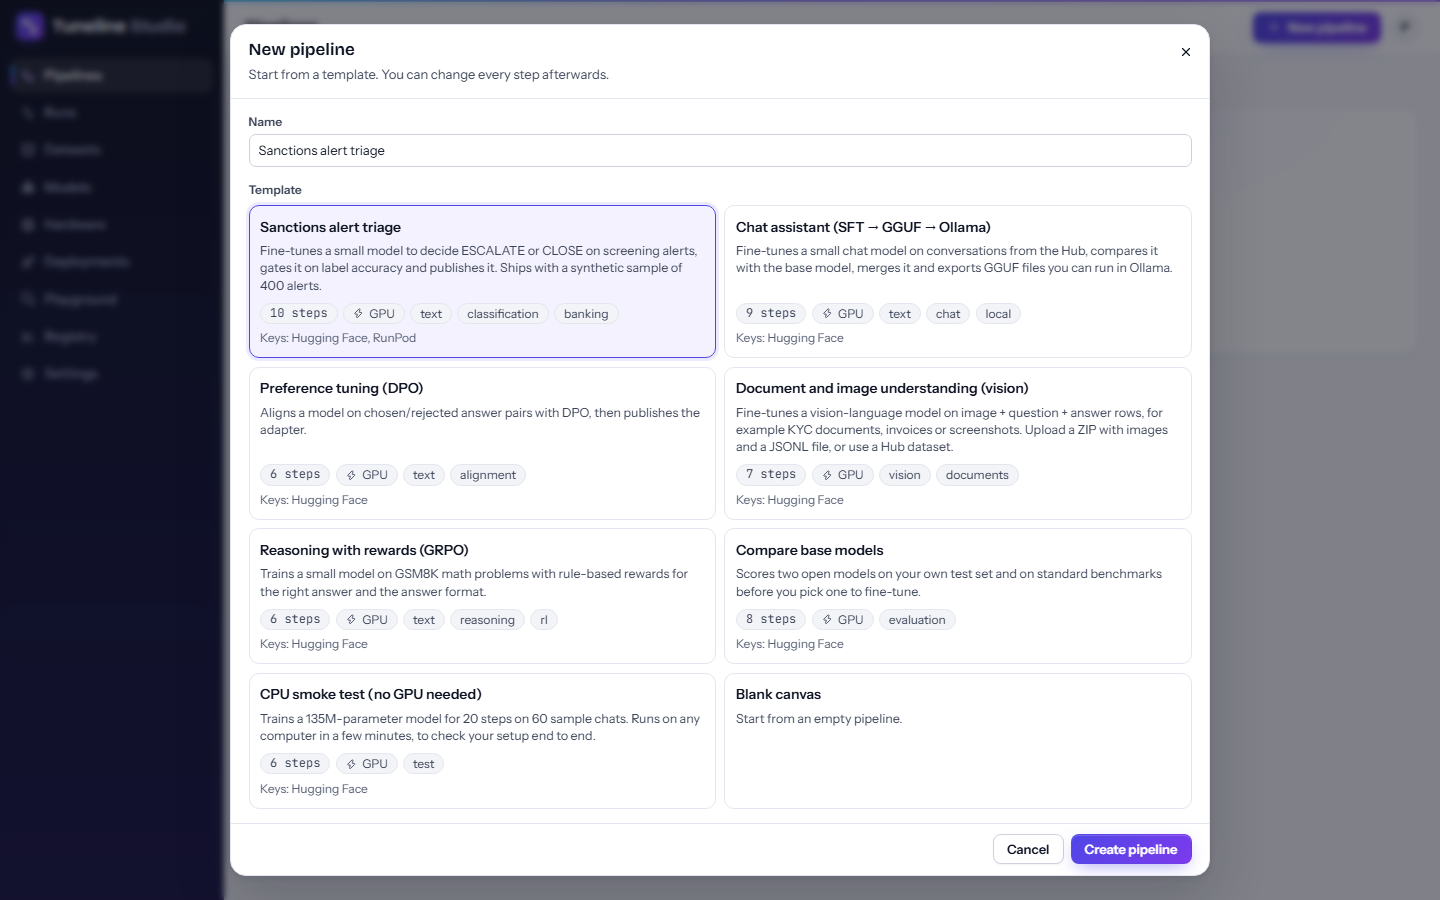
The pipeline editor opens with six connected steps.
2. Take a quick tour of the editor
The editor has three columns:
| Area | What it does |
|---|---|
| Steps (left) | Every block you can add, grouped as data, model, train, evaluation, export and deploy. Each shows its input and output types. Drag one onto the canvas, or click it to add it. |
| Canvas (center) | Your pipeline. Connect a step's output dot to another step's input dot; connections only accept matching types. Tabs above the canvas switch between Canvas, YAML and Runs. |
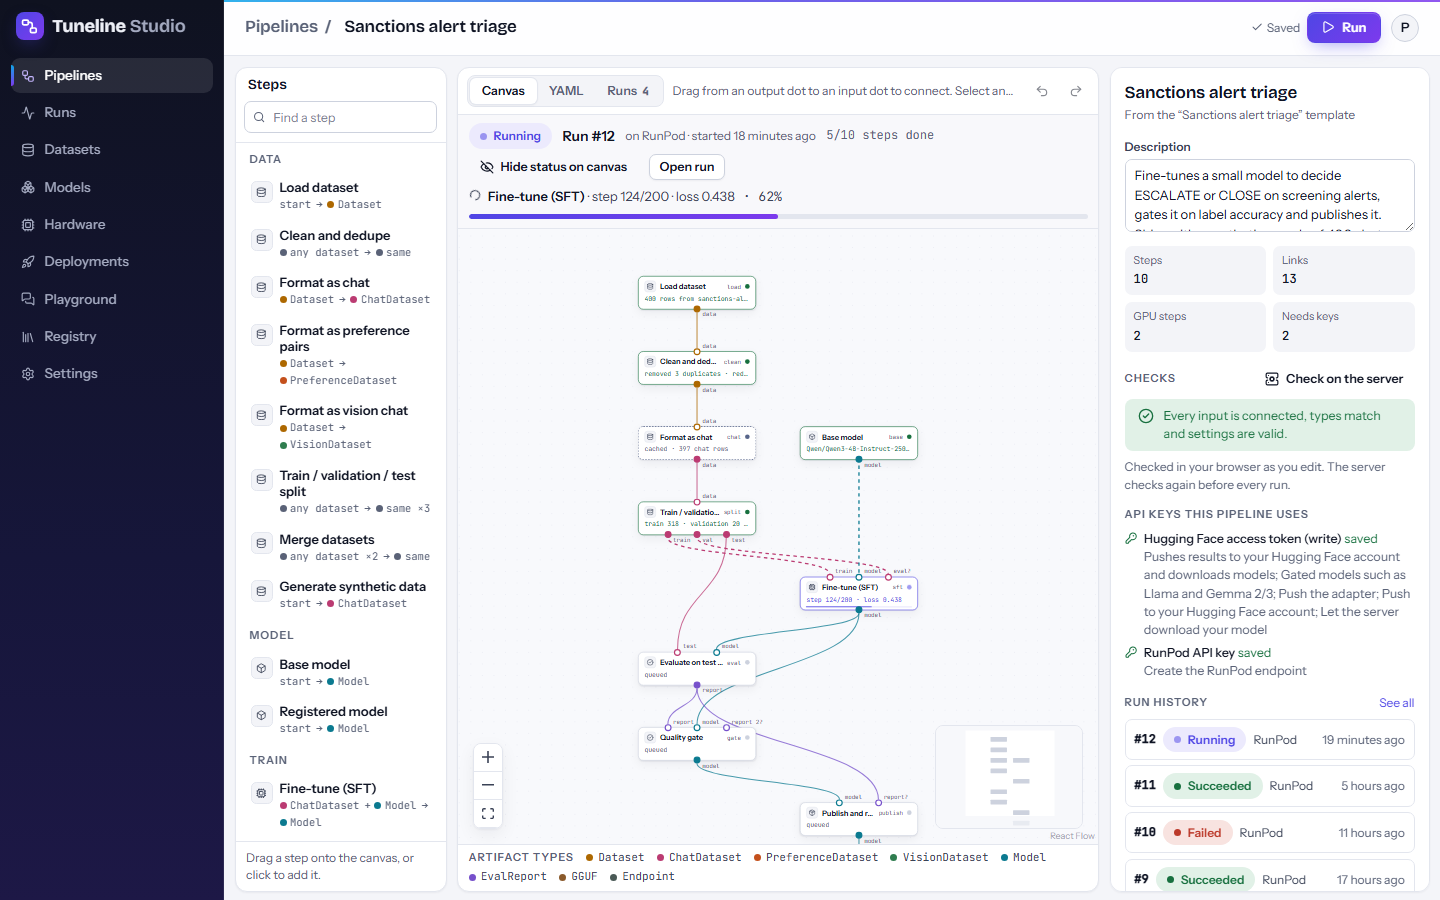
| Inspector (right) | The settings of the selected step. With nothing selected, it shows a pipeline summary, validation checks, the API keys the pipeline uses and its run history. |
The smoke test's steps, top to bottom:
| Step | What it does here |
|---|---|
| Load dataset | Downloads tiny-chat.jsonl, 60 short sample conversations. |
| Format as chat | Turns them into chat messages the model can train on. |
| Train / validation / test split | Keeps 10% of the examples aside as a test set. |
| Base model | HuggingFaceTB/SmolLM2-135M-Instruct, a small instruction-tuned model. |
| Fine-tune (SFT) | LoRA training (rank 8) in full precision (fp32) on the CPU, batch size 1, for 20 steps. |
| Evaluate on test set | Answers the test prompts with the fine-tuned model and with the base model, and scores both with ROUGE-L. |
Click any step to see its settings in the inspector. When a step is selected, the bar under the canvas offers Edit settings and Delete node. Changes save automatically; the top bar shows Saved. Undo and redo work with Ctrl+Z and Ctrl+Shift+Z.
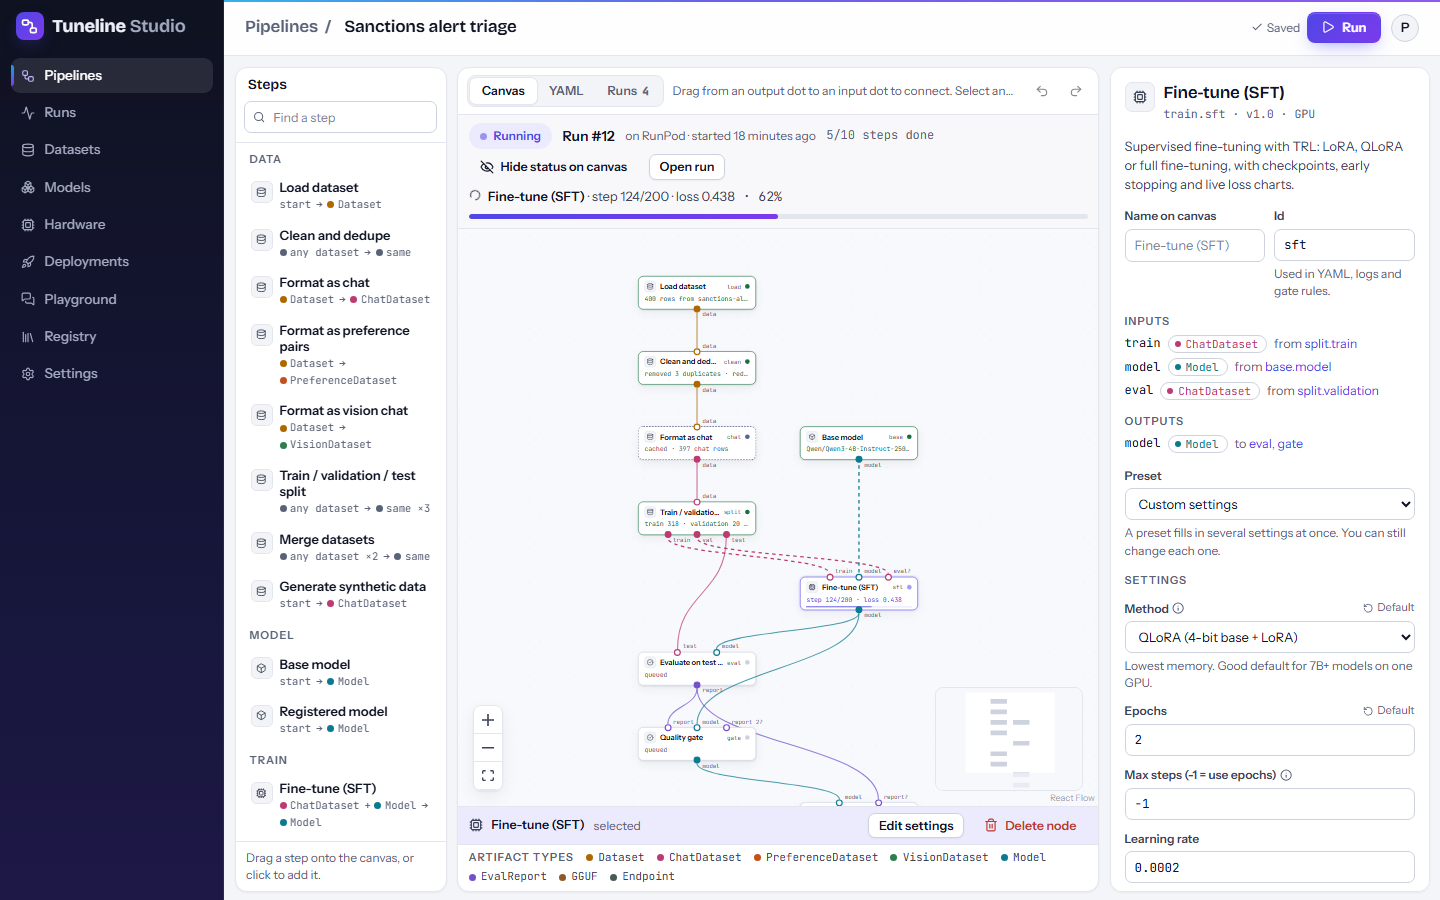
Don't change anything for this first run.
3. Start the run
- Select Run in the top-right corner. The Run pipeline dialog opens.
- Under Where to run, choose My computer or Notebook. Both are marked free. The Hardware section explains that the run uses the machine's GPU if it has one, and the CPU otherwise.
- Leave Limits and options as they are, and select Start run.
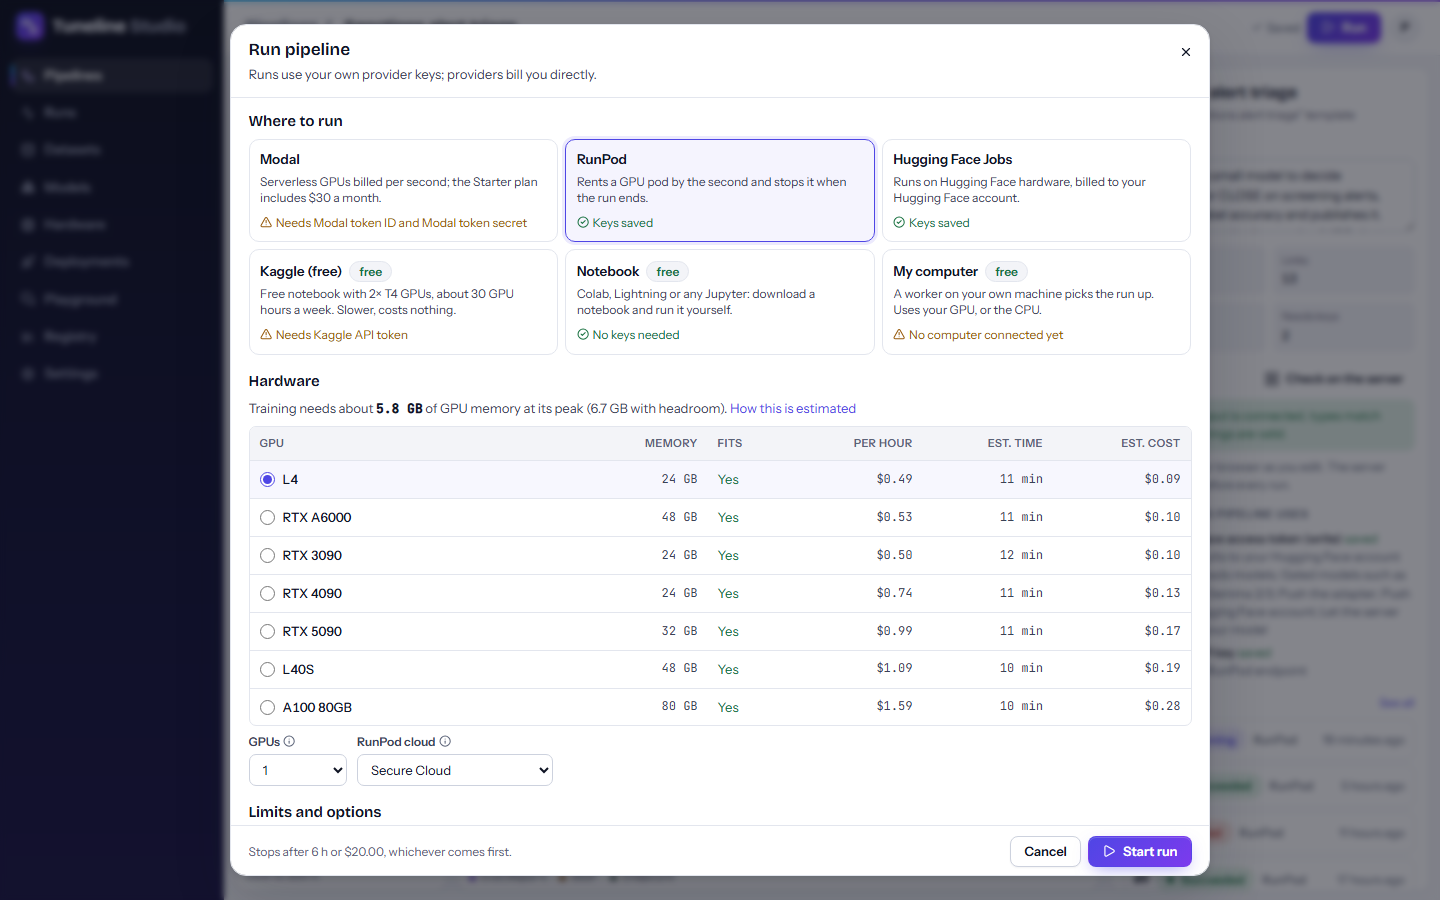
The dialog then shows Run #N is ready to start. What happens next depends on your choice.
If you chose My computer
If your computer is online, the dialog says it "starts this run within 30 seconds". Nothing else to do: select Open the run page, or close the dialog and watch from the pipeline.
If the dialog says no computer is connected or your computer is offline, the run waits in the queue. Finish the one-time setup in Settings → Your computers (see Install), and the run starts as soon as the worker connects.
If you chose Notebook
- Select Download notebook.
- Open it in Google Colab (File → Upload notebook), Lightning AI or any Jupyter server.
- The default CPU runtime is fine for this template. Run all cells.
- Keep the Tuneline tab open: the run page updates live while the notebook runs.
The notebook contains a private run token. Don't share it.
4. Watch it live
Go back to the pipeline (or stay on it). While the run is active, a banner above the canvas shows:
- the run number, where it runs and when it started;
- the step that is working, with its latest message (for training, the step number and the loss) and its progress;
- how many steps are done, with a progress bar.
Each step on the canvas is colored by its status: queued, running, cached, succeeded, failed or skipped. Select Hide status on canvas to see your pipeline without the run colors, and Show status on canvas to bring them back. Select Open run to go to the run page.
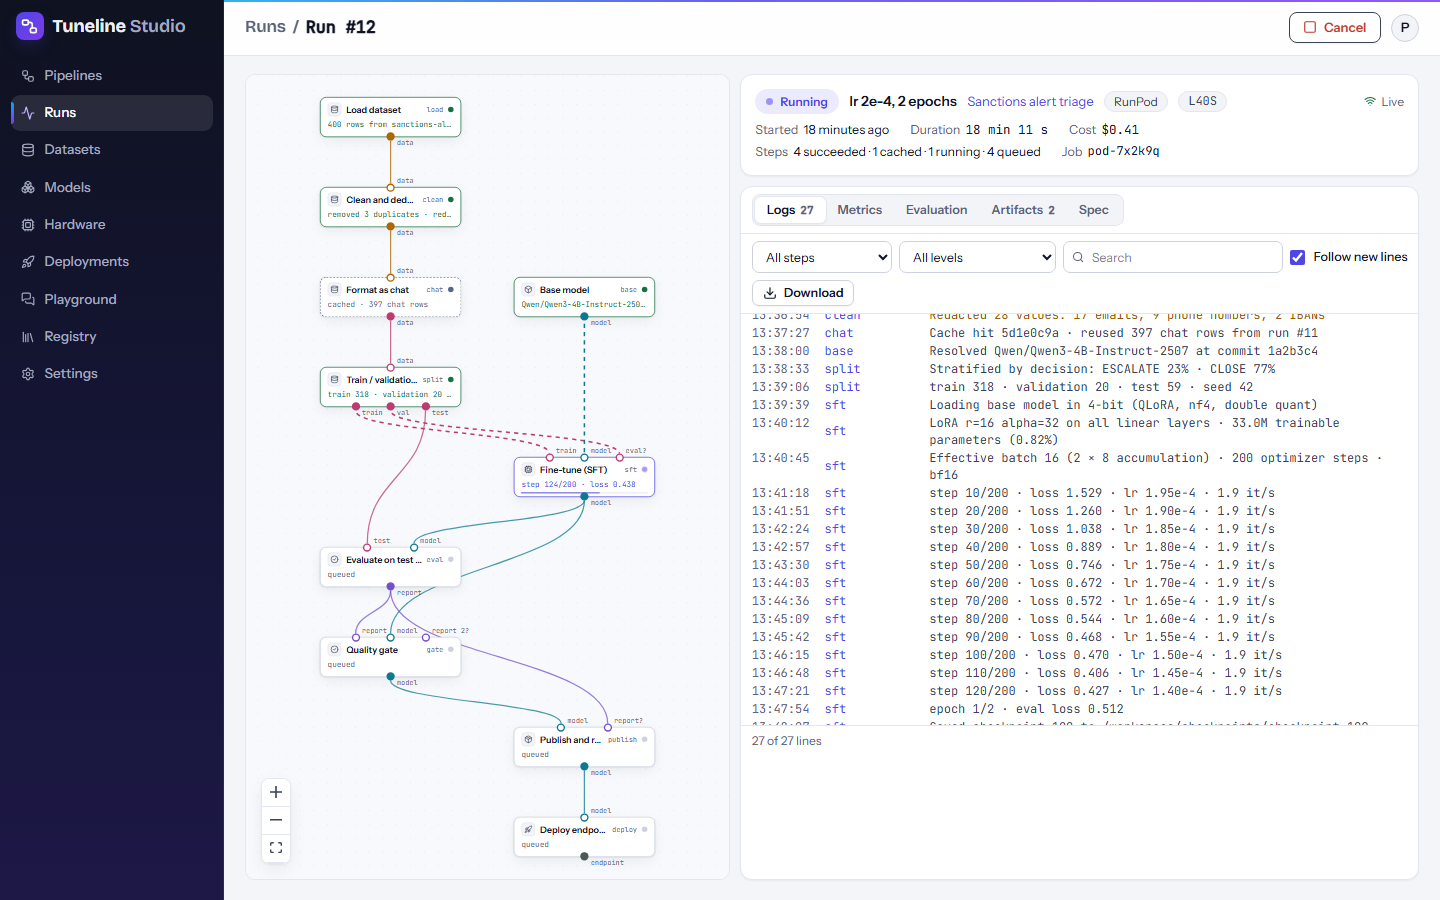
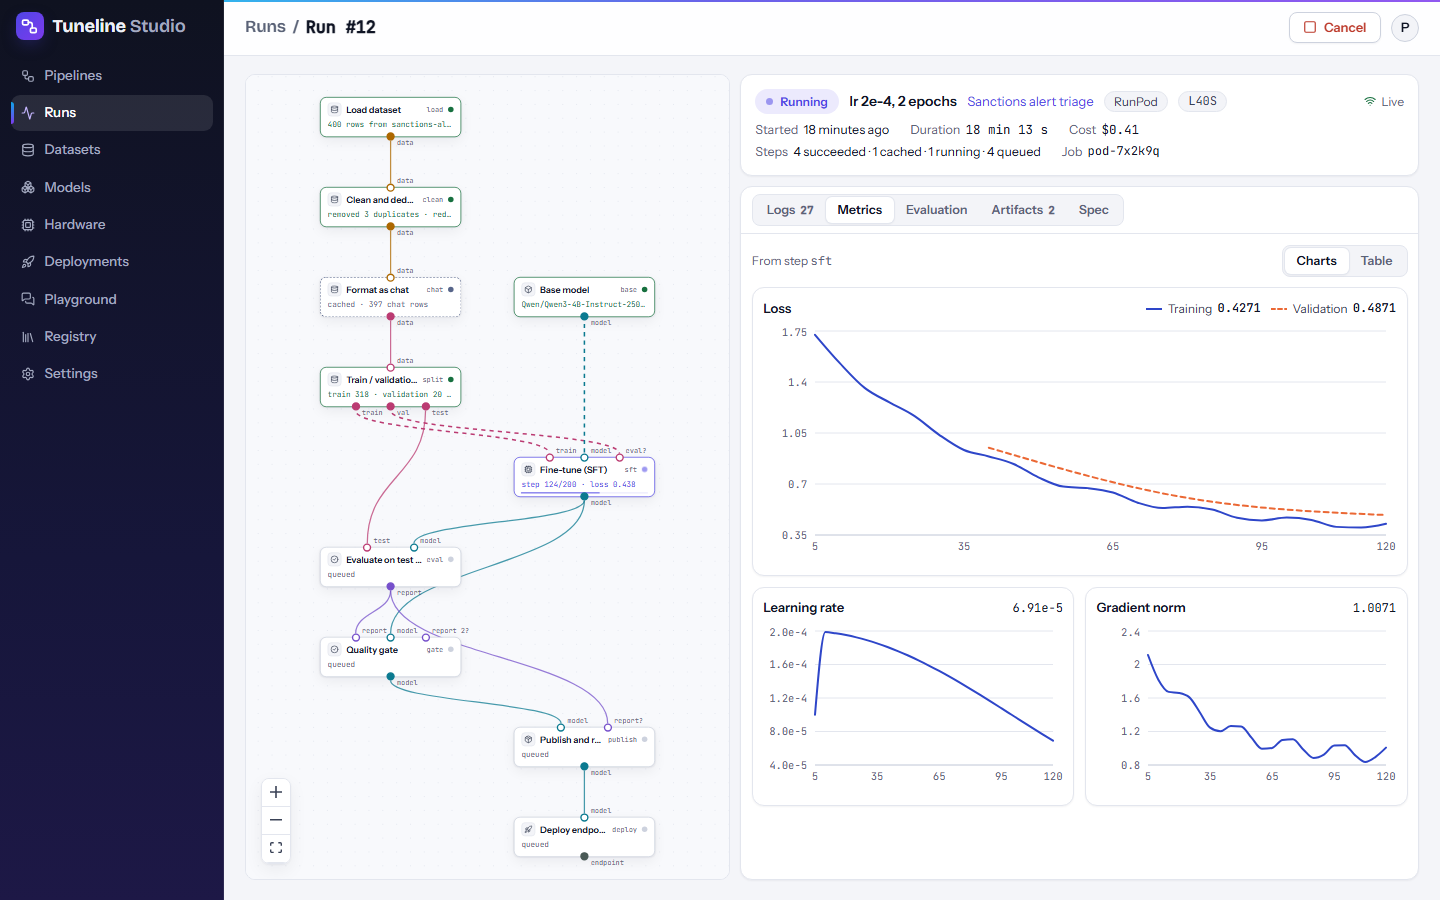
The run page shows the same graph next to five tabs:
| Tab | What you see |
|---|---|
| Logs | Every log line, filterable by step and level, with Download. |
| Metrics | Training loss, learning rate and gradient norm, by step. |
| Evaluation | The evaluation report: base model versus fine-tuned model, with the difference. |
| Artifacts | What the run produced, with links. |
| Spec | The exact settings the run used. |
5. Read the results
When every step is green, the banner says the run finished and how long it took. Open the run page and look at three things.
Logs. The data steps report how many examples they produced. The smoke test's 60 sample chats become about 75 training examples after formatting, and the split puts most of them in the training set and a handful in the test set.
Metrics. The training loss should go down over the 20 steps. With a batch size of 1 the curve is noisy, but the trend should be clear.
Evaluation. The report lists rouge_l for the fine-tuned model and for the base model, and the difference
between them. ROUGE-L measures how much of the expected answer's wording appears in the model's answer, from 0 to 1.
A positive difference means the fine-tuned model's answers are closer to the examples than the base model's. The
report appears when the evaluation step finishes.
Example: a real run
A run of this template on a CPU on 28 September 2026 gave:
| What | Result |
|---|---|
| Data | 60 sample chats, 75 examples after formatting |
| Split | 67 train, 0 validation, 8 test |
| Model and method | SmolLM2-135M-Instruct, LoRA rank 8, fp32 on CPU |
| Training | 20 steps, loss from 1.21 to about 0.69 |
| Evaluation | rouge_l 0.650, which is 0.273 higher than the base model |
| Duration | 1.1 minutes |
Your numbers will differ slightly, and the run takes longer on a slow computer or while the model downloads for the first time.
If something fails
The failed step turns red and the banner shows its error. Open the run, filter Logs by that step, and see Troubleshooting. After you fix the problem, run the pipeline again. With Reuse cached steps turned on in the Run dialog (the default), steps whose settings and inputs haven't changed reuse their earlier results.
What you learned
- How to create a pipeline from a template and find your way around the editor.
- How to start a run on your own computer or in a notebook.
- How to follow a run live from the pipeline and the run page.
- How to read the loss curve and a base-versus-tuned evaluation report.
Next steps
- Train a real model and use it in an app: Fine-tune and use your own model.
- Learn every part of the editor: Pipeline editor.
- Learn more about runs and their statuses: Monitoring runs.