Watching runs
Follow a run live on the pipeline canvas and on its run page, read its logs and charts, compare runs, and cancel or repeat them.
Every time you press Start run in the Run dialog, Tuneline Studio creates a numbered run (Run #1, Run #2, ...) for that pipeline. The job reports its progress back as it works, and the pages below update on their own, without reloading.
On the pipeline page
While a run of the pipeline you are editing is going, a status banner appears above the canvas.
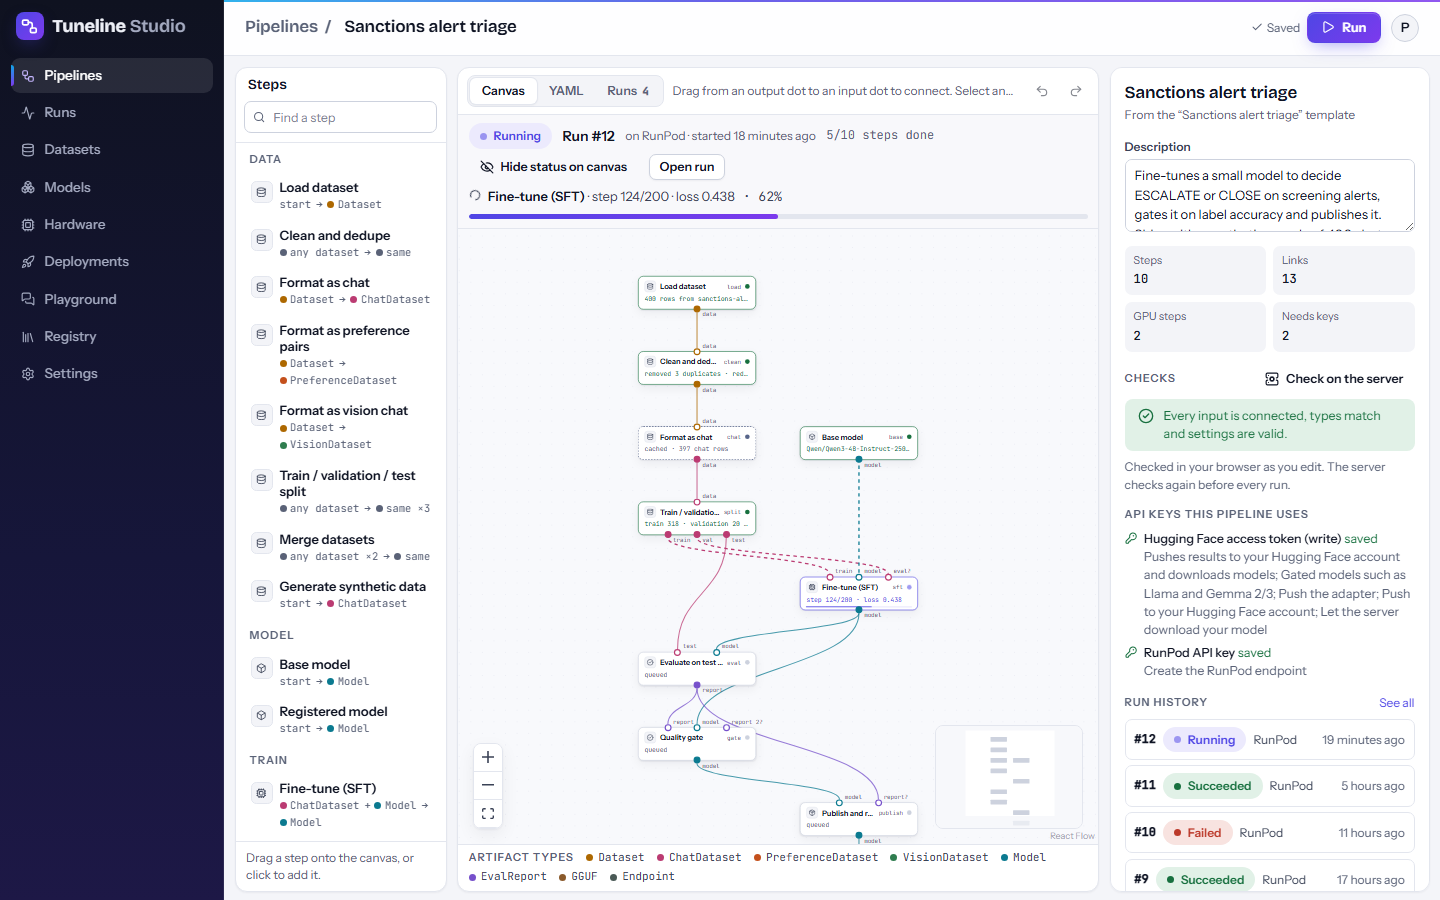
The banner shows:
- the run status (for example Running) and Run #N;
- where it runs (for example "on RunPod" or "on your computer "office-4090"") and when it started;
- how many steps are done, for example
5/10 steps done; - the step that is working now, with its latest message and percentage, for example "Fine-tune (SFT) · step 124/200 · loss 0.438 · 62%";
- a progress bar for the whole run.
Two buttons sit on the right:
- Hide status on canvas (or Show status on canvas) turns the step colours on the canvas off and on. Hiding them is handy when you want to edit the pipeline while it runs.
- Open run opens the run page.
When the run ends, the banner says how it went ("Finished in 12 min on Kaggle", or which step failed and why) and stays until you dismiss it with the close button.
Note
Editing the pipeline while it runs does not change the running job. The run uses the graph as it was when you pressed Start run.
Step colours on the canvas
Each step on the canvas shows the status of its part of the run:
| Status | How it looks | Meaning |
|---|---|---|
| Queued | grey dot | Waiting for earlier steps. |
| Running | indigo border, pulsing dot, progress bar and message | Working now. |
| Succeeded | green border | Finished and saved its outputs. |
| Cached | dashed slate-blue border | Nothing changed since an earlier run, so its earlier outputs were reused. See caching. |
| Failed | red border and background | Stopped with an error. The message on the step says why. |
| Skipped | faded | Did not run because a step before it failed, was skipped, or a quality gate did not pass. |
| Cancelled | faded | Stopped because you cancelled the run. |
Links into a running step are animated, so you can see where data is flowing.
The run page
Open a run from the banner (Open run), from the Runs tab above the canvas, from the run history in the inspector, or from the Runs page.
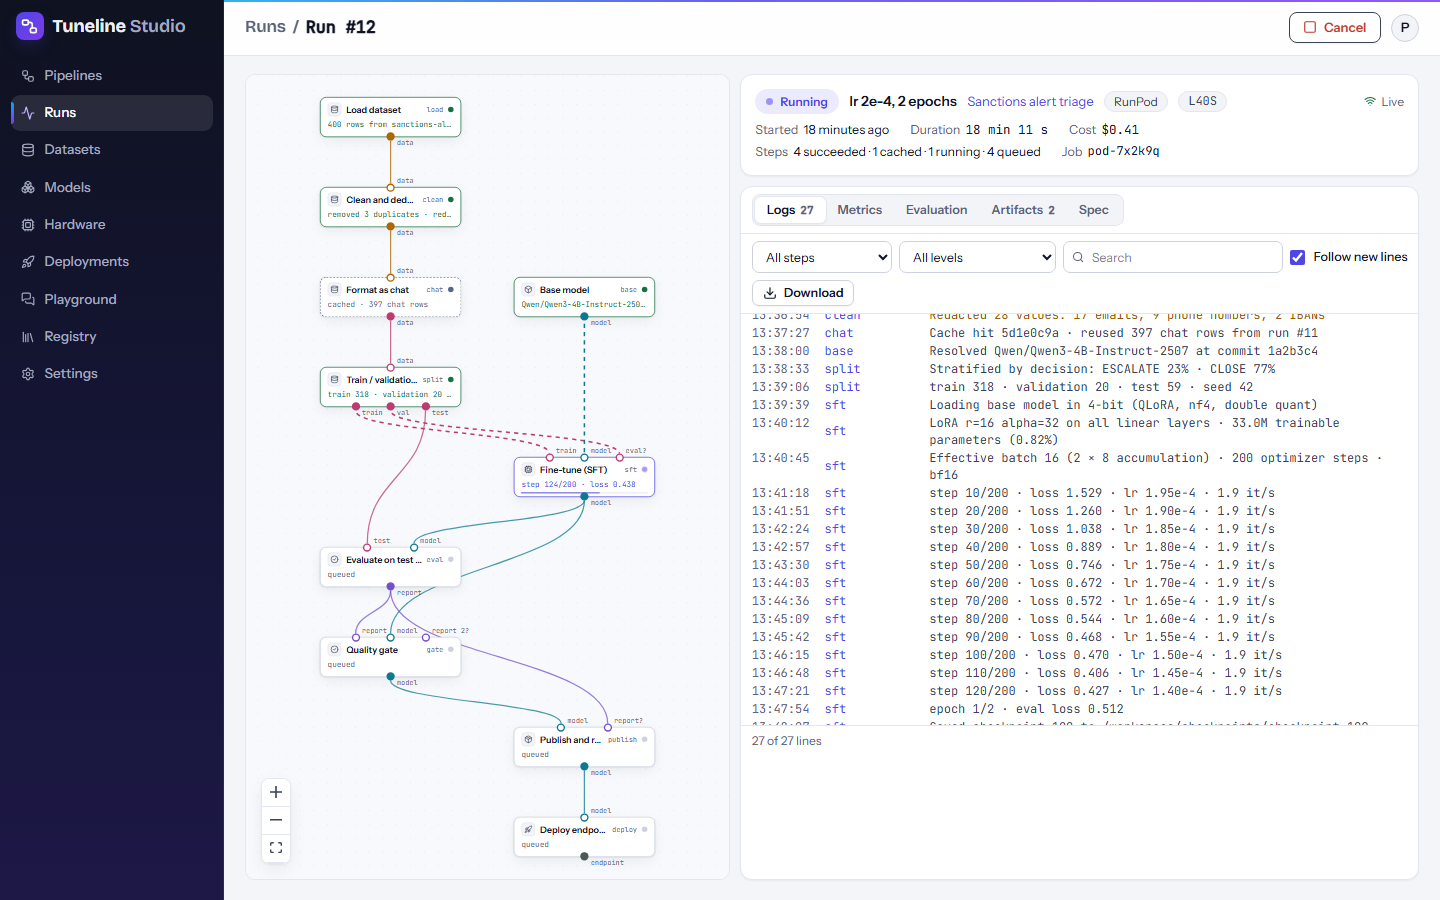
Header
The summary at the top shows:
- the status pill, the run name (if you gave one in the Run dialog) and a link to the pipeline;
- where it runs (for example RunPod) and the GPU (for example
L40S, orCPU); - a connection indicator: Live means updates arrive as they happen; Reconnecting… updates will catch up means the live connection dropped for a moment. If it says Live updates paused, press Refresh;
- Started, Duration (ticks live while the run is active) and Cost (Est. cost once a paid run has finished, Free on free options);
- Steps: a count per status, for example
4 succeeded · 1 cached · 1 running · 4 queued; - Job: the provider's job id, useful when you look the job up in the provider's console.
If the run failed, its error is shown in red below the summary.
In the top bar, Cancel stops an active run and Run again starts a new run of a finished one. See Cancel and run again.
Graph
The graph on the left is a read-only copy of the pipeline as this run used it, with each step coloured by its status (same colours as the canvas). Click a step to show only its log lines; click it again, or the empty background, to show all steps.
Logs
The Logs tab lists every line the run wrote, with the time and the step it came from.
- All steps filters by step. You can also click a step name in a log line.
- All levels filters by level: Info and above, Warnings and errors, or Errors only. Warnings are amber, errors red.
- Search finds text in the messages.
- Follow new lines keeps the newest line in view. Scrolling up turns it off; tick it again to follow.
- Download saves the whole log as a text file (
run-<number>.log). - Load earlier lines appears on long runs; press it to fetch older lines.
Metrics
The Metrics tab draws the numbers a training step reports every few steps (set by Log every N steps on the training block).
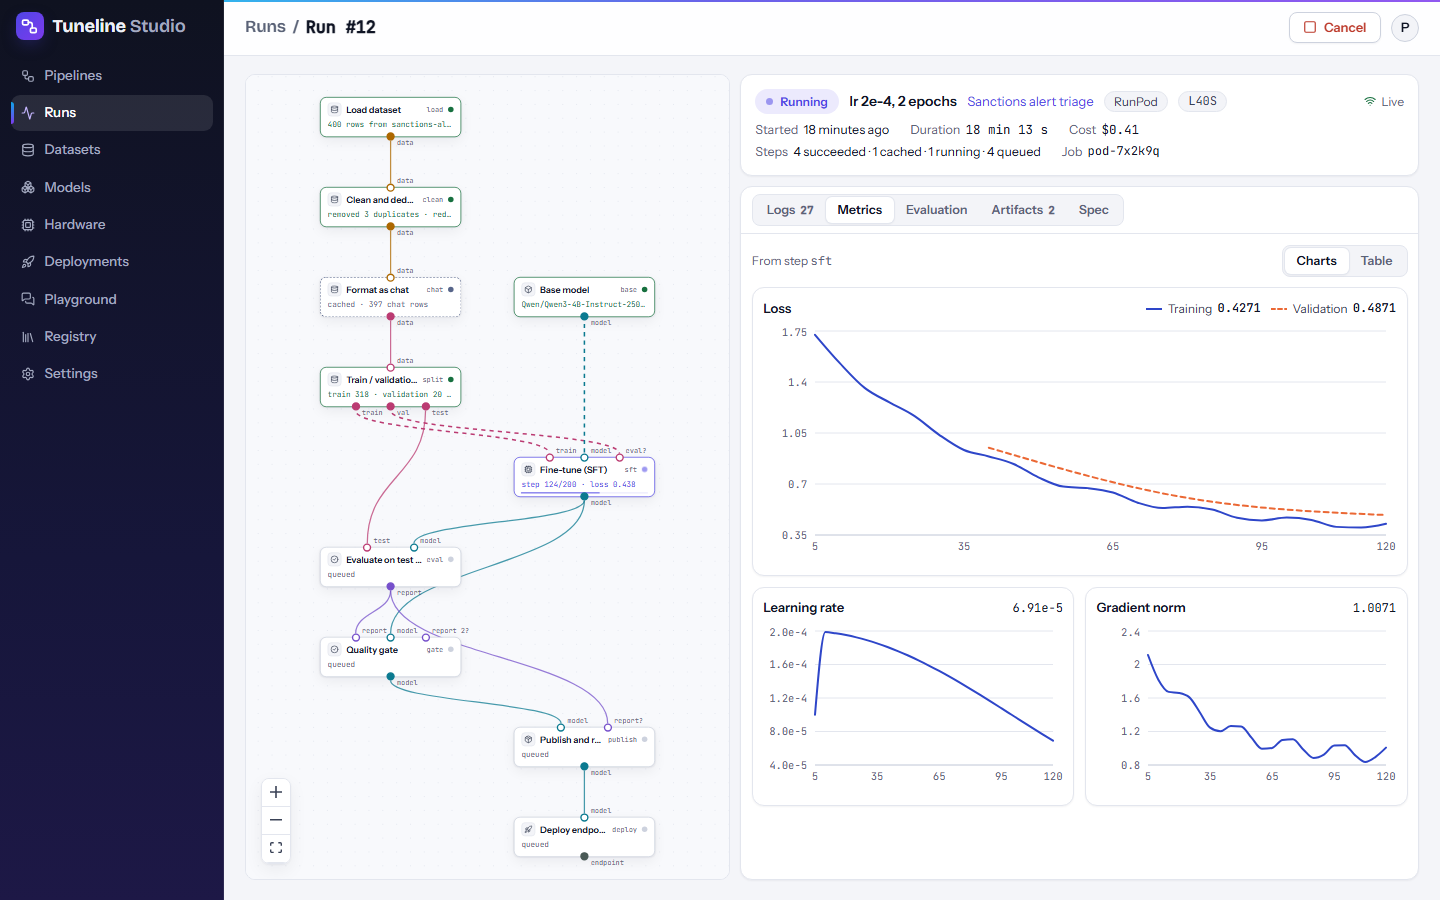
Charts appear only for what the step reports:
| Chart | What it tells you |
|---|---|
| Loss | Training loss, and validation loss (dashed) when the training block has validation data connected. Both should trend down; validation loss rising while training loss keeps falling is a sign of overfitting. |
| Rewards | Preference and reinforcement training (DPO, GRPO) report their reward values here. |
| Learning rate | The schedule, for example warm-up followed by cosine decay. |
| Gradient norm | Spikes can mean the learning rate is too high. |
| Token accuracy | Share of tokens the model predicts correctly on the training data. |
| GPU memory (GB) | Memory in use, to see how close you are to the limit. |
If the pipeline has more than one training step, pick one in Step. Switch between Charts and Table; the table lists each metric with its latest, lowest and highest value. Hover a chart to see the value and epoch at each step.
Evaluation
The Evaluation tab shows the report of each evaluation step: scores for the tuned model, the base model and the change between them, per-label scores, the quality gate's rule checks, and sample answers side by side. Until the evaluation step finishes it says "The evaluation report appears when its step finishes". See Evaluation and quality gates.
Artifacts
The Artifacts tab lists what each step saved: datasets, adapters, merged models, GGUF files, evaluation reports and endpoints, with a link to the Hugging Face repository when there is one.
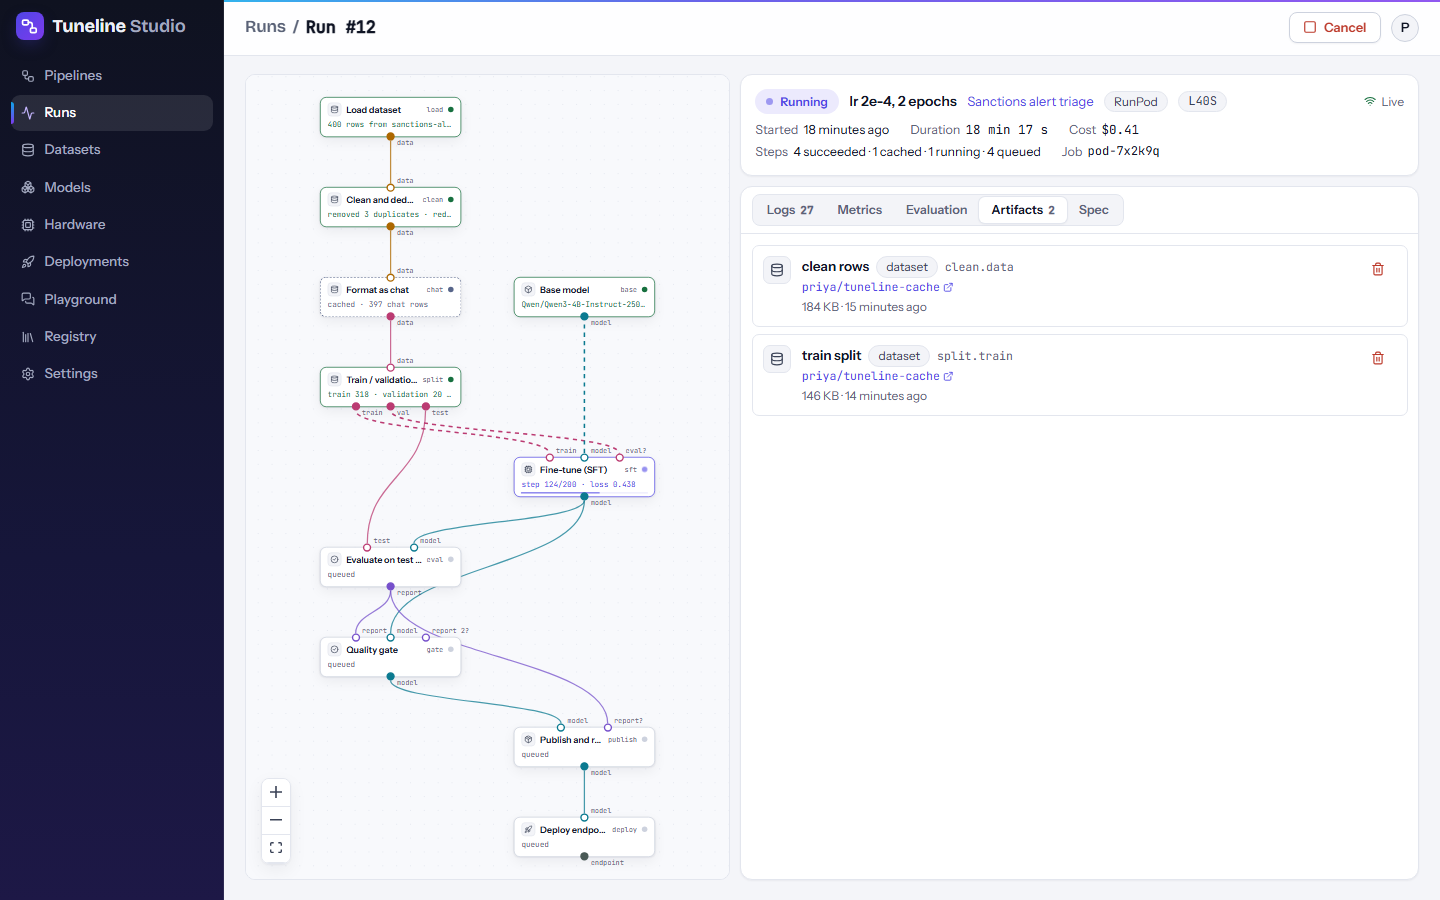
Actions per artifact:
- Register (models and GGUF files) adds the artifact as a new version in your Registry, with the run's evaluation scores attached.
- Deploy (models on the Hugging Face Hub) opens the New endpoint dialog with the model filled in. See Deployments.
- Open in playground (endpoints) opens the Playground with that endpoint selected.
- The bin button removes the artifact from the cache, so the next run rebuilds that step. Files on Hugging Face stay where they are.
Spec
The Spec tab shows exactly what the run executed: Spec (JSON), the compiled run specification with every setting (with Copy JSON and Download), and Graph (YAML), the pipeline as this run used it, in the pipeline YAML format.
Runs on your computer or in a notebook
For My computer and Notebook runs, the run page shows an extra box while the run is queued:
- Waiting for your computer says whether the computer that should take the run is online. If it is, the run starts within 30 seconds and you don't need to do anything. If no computer is connected, or it is offline, follow the link to Settings → Your computers (see Your own computer). Or start just this run from a terminal gives a one-off command for any machine with Python 3.10 or newer.
- Start this run from a notebook has a Download notebook button and the steps to run it in Google Colab, Lightning AI or any Jupyter server. Or run it from a terminal gives a command instead (press Show the command).
Warning
The notebook and the command contain a private run token for this run. Don't share them.
Keep the run page open if you like: it updates live while the notebook or your computer works.
The Runs page
The Runs page lists every run of every pipeline, newest first.
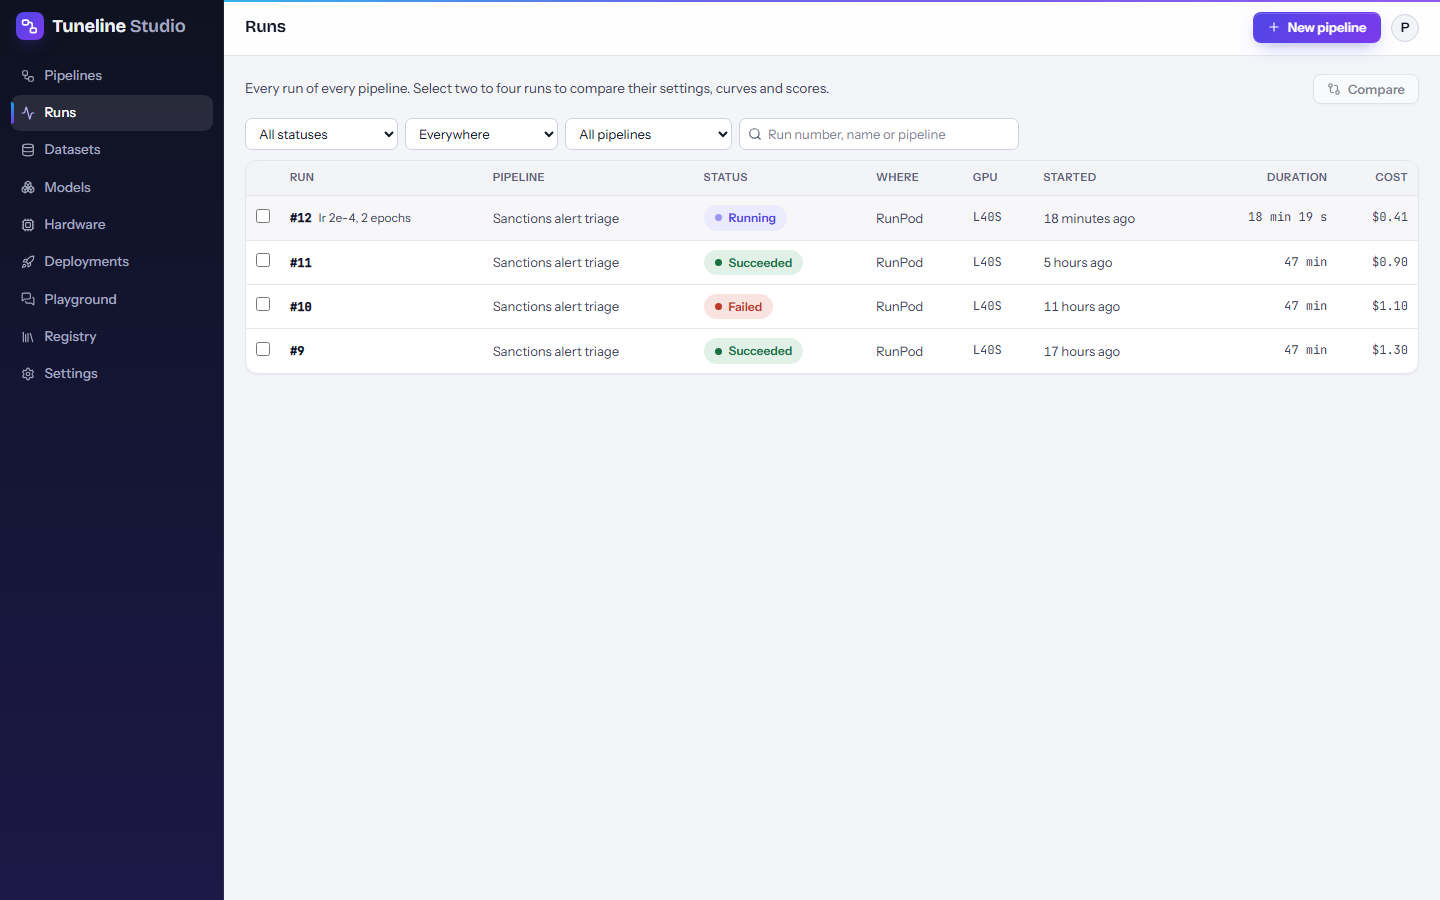
The table shows the run number (and name), pipeline, status, where it ran, GPU, when it started, duration and cost. Use the filters above it:
- status: All statuses, Queued or running, Succeeded, Failed, Cancelled;
- where: Everywhere or one target (Modal, RunPod, Hugging Face Jobs, Kaggle, Notebook, My computer);
- pipeline: All pipelines or one;
- a search box for the run number, run name or pipeline name.
The page shows 100 runs at a time; press Show older runs for more.
Compare runs
To see what changed between runs and which one did better:
- Tick the box in front of two to four runs.
- Press Compare (it shows Compare 3 runs, for example).
The comparison page has three parts:
- Settings: every setting that differs between the runs, one row per setting (for example
sft.learning_rateorrun.gpu). Tick Show settings that are the same to see all of them. - Training loss and Validation loss: the curves of all runs on one chart, one colour per run.
- Evaluation scores: each run's scores side by side. The best value in each row is in bold (the highest, or the lowest for latency and loss).
Clear selection unticks all runs.
Cancel and run again
Cancel a run
- On the run page, press Cancel.
- Confirm with Cancel run (or press Keep running).
The run stops at its next safe point: training checks after every step, so it stops quickly. You see "Cancel requested. The run stops at its next safe point" until it does, then the status becomes Cancelled. For cloud targets, Tuneline Studio also stops the job at the provider. Steps that already finished stay cached, so a later run reuses them.
Run again
On a finished run (succeeded, failed or cancelled), press Run again. It starts a new run with the same graph and the same place to run, and opens its page. Unchanged steps are reused from the cache when caching is on.
To change settings first, edit the pipeline and press Run in the editor instead.
Run statuses
| Run status | Meaning |
|---|---|
| Queued | Created, waiting to start. My computer runs wait here until your computer picks them up. |
| Launching | The job is being started at the provider (or your computer has claimed it). |
| Running | The runner is working through the steps. |
| Succeeded | Every step succeeded, was cached, or was skipped by a gate set to keep the run successful. |
| Failed | At least one step failed, or the job stopped responding. The error says which step and why. |
| Cancelled | You cancelled it, or it reached its time or cost limit. |
A failed step does not stop independent branches: steps that don't depend on it still run.
Tuneline Studio also checks active runs in the background every few minutes. A run whose job never starts, or whose runner stops reporting, is marked failed with a reason such as "Lost contact with the worker: no heartbeat for 20 minutes. Check that it is still running, then Retry." See Troubleshooting.
Cost and time limits
The Run dialog sets two limits for each run: Stop after (hours) and, for paid targets, Stop at cost (USD). The runner stops itself at whichever comes first, using the estimated hourly price of the GPU you picked, and the run ends as Cancelled with the reason.
The Cost column shows an estimate for runs on paid GPUs (Modal, RunPod, Hugging Face Jobs): when the run ends, the runner multiplies the GPU's hourly price by how long it worked. The run page labels it Est. cost. Runs on free options (Kaggle, Notebook, My computer) show Free, and a run still in progress shows –. Start-up time before the runner begins isn't included, so your provider's billing page is always the exact figure. For estimates before you run, see Hardware and costs.